
Game Support Metrics: The KPIs Every Studio Should Track

Updated: Aug 11
Most game studios track the wrong support metrics. Ticket volume shows workload, not whether players are satisfied or likely to stay. The right KPIs help reduce churn, improve support efficiency, and get players back into the game faster. This article covers 11 essential game support KPIs across four areas: player satisfaction, response speed, operational efficiency, and game impact. You will learn what each metric measures, relevant gaming benchmarks, and how to use the data to improve support performance. For studios evaluating outsourced support partners, these KPIs also provide a practical framework for setting SLAs and performance standards.
Key Takeaways
Volume is not a health metric: Ticket volume measures workload, not player happiness. Satisfaction and retention metrics like CSAT, NPS, and FCR connect daily support to whether players keep playing and spending.
Speed directly drives churn: 75% of gamers expect a reply within 24 hours, and roughly 30% have quit a game over slow support, yet the average gaming response time is around 39 hours. Speed is a churn lever, not a courtesy.
Benchmarks need a gaming context: Account recovery and payment disputes require identity verification, so do not penalize agents on First Contact Resolution for those ticket types. Separate them in reporting.
Automation and backlog reveal sustainability: Mature self-service deflection (70% or more) keeps human agents free for complex issues, while a backlog that keeps growing after an event closes is an early structural warning of under-resourcing.
Set targets before you need them: Define KPIs and SLA targets before go-live, contractualize 5 to 8 of them, and review monthly so problems surface as trends rather than surprises.
Category 1 - Player Satisfaction & Quality
Satisfaction metrics are the most important category because they connect your daily operations directly to retention outcomes, not just operational efficiency. A team can close tickets quickly and cheaply while still losing players. These three KPIs: CSAT, FCR, and NPS, are the ones that tell you whether support is protecting the player relationship or quietly eroding it.
Customer Satisfaction Score (CSAT)
What it is: A post-ticket survey score measuring how satisfied a player was with their support experience, typically collected on a 1 to 5 or 1 to 10 scale immediately after the ticket is resolved.
Why it matters in gaming: Support interactions in gaming happen in emotionally charged moments: an account lockout mid-session, missing rewards after a live event, or a failed purchase. CSAT in this context is not a vanity metric. It is a retention signal. A player who rates their support a 1 or 2 is a measurable churn risk, and each of those interactions is an opportunity to turn the outcome around.
Benchmark: The cross-industry CSAT average sits around 78% (Salesforce), with 75 to 85% generally considered good and anything above 80% considered strong. Tech and SaaS teams often target 85% or higher. Treat 78% as your floor to aim above, not your ceiling.
When the number is off: A CSAT below 75% usually signals a systemic issue, not individual agent performance. Common causes are slow response times, unresolved tickets, or agents giving generic answers to game-specific questions. Start by examining AHT and FCR to find the root cause before coaching individuals.

First Contact Resolution (FCR)
What it is: The percentage of player issues resolved in a single ticket interaction, without the player needing to follow up, reopen, or be passed to another agent.
Why it matters in gaming: A low FCR means players are bouncing between tickets and agents, repeating information, and waiting longer. In live-service games, where the player is often already frustrated, each additional touchpoint increases the probability of churn. Improving FCR reduces that friction directly at the point where it is most likely to affect the player's decision to keep playing.
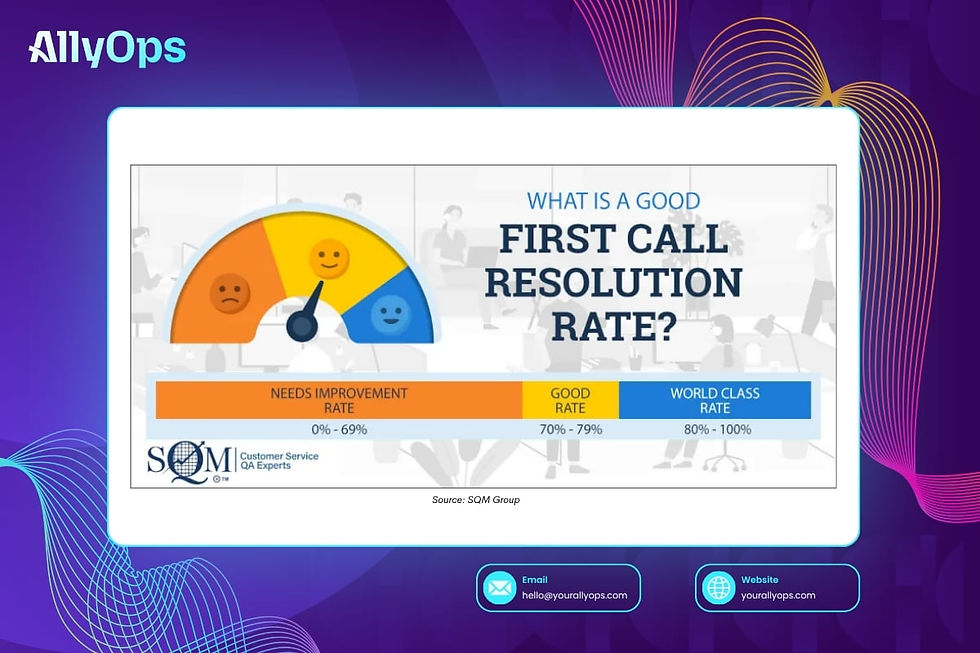
Benchmark: A healthy FCR generally falls in the 70 to 79% range (SQM Group). In gaming, though, good FCR can conflict with security. Account recovery and payment disputes require identity verification, which is a multi-step process that structurally prevents single-contact resolution. Do not penalize agents for FCR on those ticket types.
When the number is off: If FCR drops below 70%, audit your ticket categories first. If account and payment tickets are dragging the rate down, separate them in reporting. If general tickets are failing FCR, the issue is more likely agent training or knowledge-base gaps than a structural problem with the metric itself.
Net Promoter Score (NPS)
What it is: A loyalty metric that asks players how likely they are to recommend this game to a friend, on a 0 to 10 scale. Promoters (9 to 10) minus Detractors (0 to 6) equals your NPS.
Why it matters in gaming: NPS captures long-term loyalty beyond any single support interaction. A player can have a perfectly satisfactory ticket resolution and still be losing faith in the game overall. For live-service titles, NPS trends across seasons or after major patches are far more meaningful than any single data point.
Benchmark: A positive NPS (above 0) is the floor. It simply means you have more promoters than detractors. The global cross-industry average is around +32, with 30 to 50 considered strong and 50 or above excellent. NPS trending downward over two consecutive months is an early indicator of community-level retention risk that rewards a proactive response.
When the number is off: A declining NPS should trigger a cross-functional review involving support, product, and community together. NPS tells you the magnitude of a problem, not the cause. Pair it with qualitative ticket data and Discord or Reddit sentiment to find the underlying reason.
Category 2, Response & Resolution Speed
Speed metrics carry higher stakes in gaming than almost anywhere else. A player who waits too long during a live event, a seasonal pass window, or a competitive match does not just get frustrated. 75% of gamers expect a response within 24 hours, roughly 30% have stopped playing a game because support did not respond quickly enough, yet the average gaming company's response time is about 39 hours. Closing that gap is one of the most direct ways a support team can protect player retention.
Average Handle Time (AHT)
What it is: The average duration an agent spends handling a player query, from the moment the player engages support until post-interaction work is complete, including authentication, data lookup, and note-taking.
Why it matters in gaming: AHT is a core efficiency metric. Shorter handle times mean shorter waits, quicker answers, and more tickets handled per agent. It also highlights which issue types agents resolve most efficiently and where teams need more support or better tooling. The caveat worth keeping in mind: AHT can penalize longer, high-quality interactions that actually create more engaged, satisfied players, and it is easily distorted by external delays such as slow player replies over email, in-game chat, or social that do not genuinely reflect poor agent performance.
When the number is off: An unusually high AHT often reflects response delays from the player rather than the agent. A player who steps away mid in-game chat before answering verification questions will make an interaction look inefficient on paper, even though the player may be perfectly satisfied with the outcome. Segment by channel and ticket type before concluding.

First Response Time (FRT)
What it is: The time elapsed between a player submitting a ticket and an agent sending the first response.
Why it matters in gaming: 75% of gamers expect a response within 24 hours, and 70% consider speed essential when choosing a gaming service. During live events or launch windows, FRT directly affects whether a player completes a purchase, finishes a challenge, or moves on. A fast first response also sets a positive tone for the entire interaction that follows.
Benchmark: Targets vary by channel. For live chat, the target is under 30 seconds; for email and ticketing, the target is within 1 to 2 hours (Comm100). Fast first-response times reduce drop-offs and measurably improve downstream CSAT scores.
When the number is off: FRT spikes are almost always a capacity problem: agent coverage gaps, a launch surge without bench capacity, or no after-hours coverage. Review ticket volume against shift coverage before adjusting individual agent targets.
Category 3, Support Volume & Operational Efficiency
This category tells studios whether their support operation is sustainable and where to invest. Volume metrics are not about how much work there is. They are about whether the system is keeping up with it. Read together, these three KPIs reveal where players seek help, how much of that demand you can resolve through automation, and whether the operation is quietly falling behind overall demand.
Ticket Volume by Channel
What it is: A breakdown of incoming player tickets by channel, covering in-game portals, Discord, email, web forms, social media, and voice.
Why it matters in gaming: Channel distribution reveals where players actually seek help. A studio routing all support through email, while 60% of tickets arrive via Discord, is structurally misaligned with its own community. Channel data also shows whether in-game support is successfully deflecting volume from external channels or whether players are bypassing it.
Benchmark: There is no universal benchmark here. The target is alignment between where players go and where your staff is. Track monthly to detect channel shifts after patches, new platform launches, or community changes.
When the number is off: A sudden spike in one channel, such as Discord flooding after a patch, signals that the knowledge base was not updated before the patch shipped, or that the in-game support pathway is not surfacing the right articles at the right moment.

Self-Service Deflection Rate
What it is: The percentage of player issues resolved by automated tools, chatbots, FAQ menus, knowledge-base articles, without any agent involvement.
Why it matters in gaming: Every deflected ticket is both a cost reduction and a faster player experience. A high deflection rate also protects human agents, keeping them available for the complex, judgment-heavy issues that automation cannot reliably handle.
Benchmark: Most chatbot deployments start at 20 to 40% deflection. Mature, well-tuned implementations reach 70 to 90%. Below 40% typically signals poor ROI and a frustrating self-service experience. The goal is to move from deflecting the easy queries toward confidently containing routine, repetitive ones such as rewards, login basics, and patch notes.
When the number is off: A falling deflection rate after a patch usually means your knowledge base and bot intents were not updated for new content. Players ask new questions that the automation cannot answer, and those tickets move to human agents. Keeping content current with every patch is the most direct fix.
Backlog Growth Rate
What it is: The rate at which unresolved tickets accumulate over a defined period, calculated as net new tickets minus resolved tickets per week or month.
Why it matters in gaming: A growing backlog is a structural warning sign worth catching early. During launches or live events, some backlog growth is expected. If it keeps climbing after the event closes, the operation is under-resourced relative to demand. Backlog also correlates with CSAT decay: the longer players wait, the lower their eventual satisfaction scores tend to be, regardless of how well the ticket is ultimately resolved.
When the number is off: Sustained positive backlog growth outside event windows means resolved-per-period is structurally below incoming volume. The fix is capacity (more agents or better deflection), not pushing individual handle time down further. Accelerating an understaffed team trades speed for quality, which compounds the original problem.
How AllyOps Tracks and Reports on These KPIs for Our Studio Partners
AllyOps provides dedicated game support teams with structured monthly business reviews (MBRs) covering all four KPI categories: player satisfaction (CSAT, FCR, NPS), speed (FRT, AHT), operational efficiency (deflection rate, backlog, cost per ticket), and game-specific impact metrics. Reporting is built to surface trends, so a two-month NPS dip or a creeping backlog shows up as a pattern you can act on rather than a problem you discover after the fact.
For every AllyOps engagement, KPIs and SLA targets are defined before go-live, not added later when performance questions arise. That structure gives studios a clear, accountable baseline from the first week of the partnership onward.
Book a free call to find out how AllyOps structures performance tracking for game studios at your growth stage.
FAQs
What are the most important game support KPIs to track?
Start with the satisfaction and retention metrics: CSAT, First Contact Resolution, and NPS. They connect support to whether players stay and spend. Layer in First Response Time and backlog growth to confirm the operation is fast and sustainable. Contractualize 5 to 8 in total, more dilutes focus.
What is a good CSAT score for game support?
Treat the cross-industry average of around 78% as your floor. Scores of 75-85% are generally good, and scores above 80% is strong. Below 75% usually signals a systemic issue, slow responses, unresolved tickets, or generic answers, rather than individual agent underperformance. Diagnosed with AHT and FCR.
How fast should a game studio respond to support tickets?
75% of gamers expect a response within 24 hours, and many expect far faster. Practical targets: under 30 seconds on live chat and within 1-2 hours on email or ticketing. The average gaming response time is around 39 hours, well short of expectation, which is exactly why FRT drives churn.
Why should First Contact Resolution not apply to all ticket types?
Account recovery and payment disputes require multi-step identity verification, which structurally prevents single-contact resolution. Penalizing agents on FCR for those tickets punishes good security. Separate them in reporting so general-ticket FCR, where training and knowledge-base gaps actually show up, stays meaningful.
What self-service deflection rate should a game studio aim for?
Most chatbot setups begin at 20-40% deflection; mature, well-maintained ones reach 70-90%. Below 40% usually means poor ROI and a frustrating experience. Keep the knowledge base and bot intents updated with every patch; stale automation is the most common reason deflection drops and tickets spill onto agents.


